1. What the tool does #
The tool shows the Sun and Earth as seen from one point on the Moon. It tells you if the Sun is up and if Earth is up at a date and time. It gives the time to the next sunset, sunrise, Earthset and Earthrise. It uses the terrain near the lunar south pole, because hills and craters can hide the Sun and Earth there.
You can use the results to estimate two things:
- Solar power. A solar panel needs the Sun.
- Direct communication with Earth. An antenna needs a line of sight to Earth.
The tool does not do these things:
- It does not calculate the power of a solar panel or the strength of a radio link.
- It does not calculate results over an area. The results are for one point.
- It does not include relay satellites, slopes, rocks or the shadow of the lander.
- It does not use terrain data north of about 60° S. There, the horizon is flat.
2. Quick start #
Do these 5 steps to see if the Sun and Earth are up at a site.
- Open the tool at lunarsite.select.
- In the left panel, under Point, select a site in the Site list. For example, select Malapert Massif.
- Under Time (UTC), set the date and the time in the date field. For example, set 6 December 2026, 00:00. The field can show the date in the format of your computer.
- Read the Verdict tab of the results panel on the right. It gives a short answer for the period. See Verdict. For the live values, click the Details tab. At the top, read Sun is up or Sun is down, and Earth is up or Earth is down.
- Read the countdown below each line. It tells you the time to the next change, for example "Sunset in 7 d 06 h 55 min".
The tool needs a few seconds to load the results. The status line says "Loading…" until the results are ready.
At your first visit, a welcome card shows below the title. It gives the 3 main steps and a link to this guide. Click ✕ to close it. Your browser keeps this setting, so the card does not show again. If your browser does not keep data, the card shows at each visit.
3. The screen #
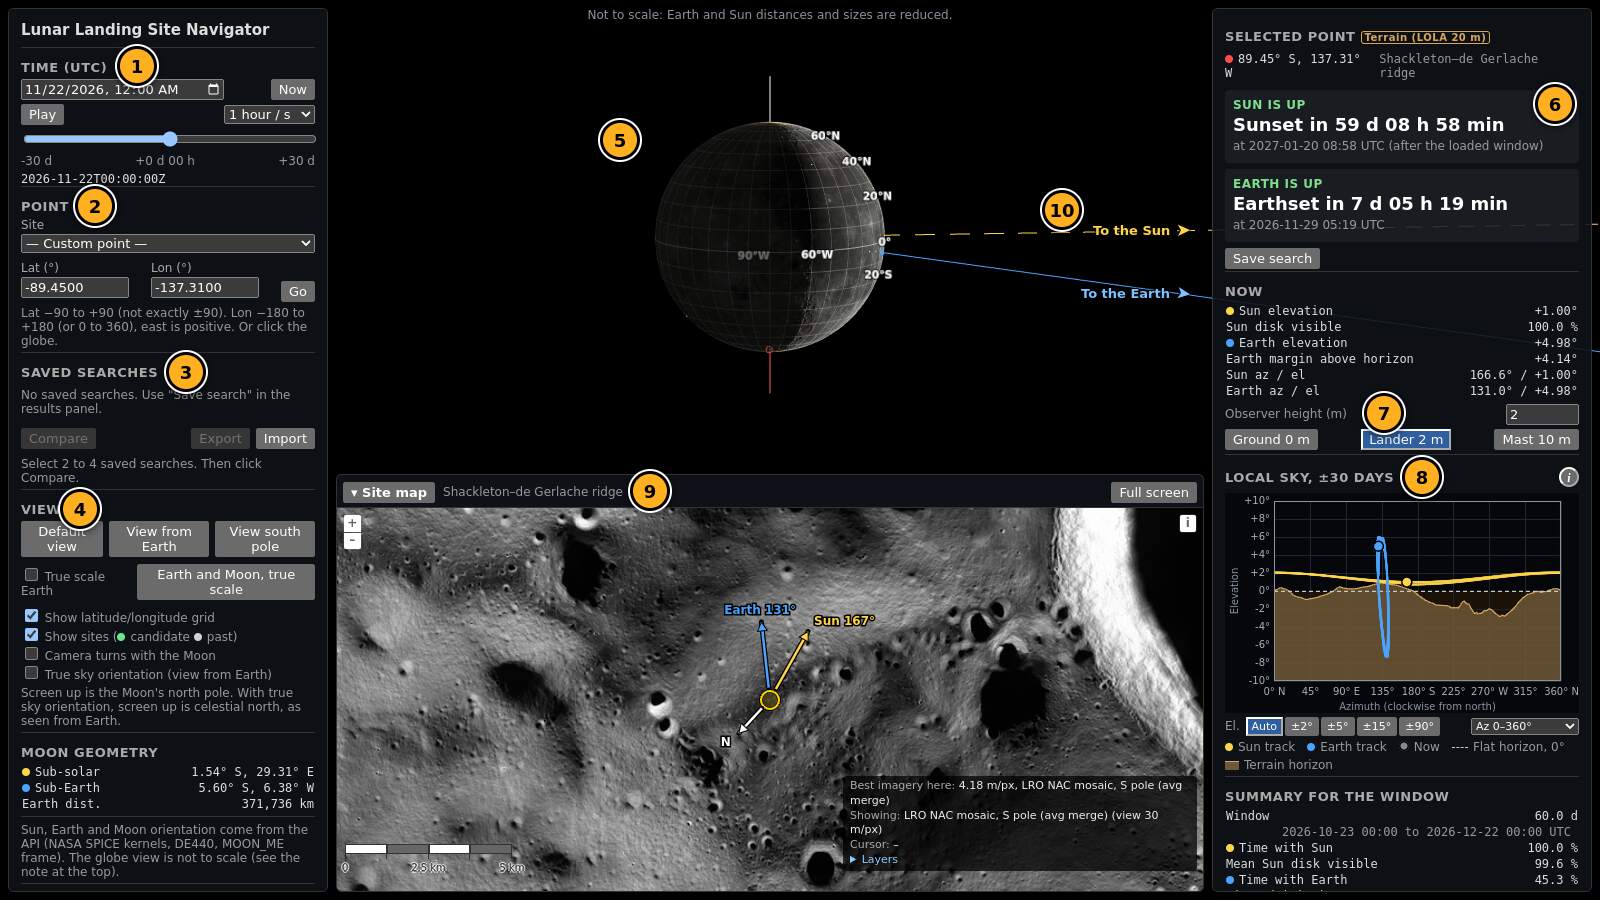
- 1Time and period (left panel). The start, the duration, the slider and Play. See Time and period.
- 2Point (left panel). The site list and the latitude and longitude fields. See Select a site.
- 3Saved searches (left panel). See Save and compare.
- 4View (left panel). The camera buttons for the globe. See The globe views.
- 5Globe. The Moon with the lit half, the grid and the sites. Drag to turn it. Use the mouse wheel to zoom.
- 6Results panel (right). It has two tabs. Verdict gives a short answer for the period (see Verdict). Details gives the selected point, the horizon tag and the two countdowns (see Read the results). The screenshot shows the Details tab.
- 7Observer height. It is in both tabs. See Observer height.
- 8Sky plot. The local sky over the period, in the Details tab. See The sky plot.
- 9Site map. NASA images of the site, with Sun and Earth arrows. See The site map.
- 10Edge arrows. "To the Sun" and "To the Earth" point to a body that is off the screen.
In the Details tab, below the sky plot, the results panel also has the result for the period, the event list and Check this result. Scroll the results panel to see them.
On a computer, use a screen that is 1280 pixels wide or more. On a smaller screen, the panels cover a large part of the globe. Scroll each panel to see all of it.
On a phone
On a phone or a narrow window (760 pixels or less), the tool shows all parts in one column. Scroll down to see them in this sequence:
- The title, the guide link and the welcome card.
- The Verdict and Details tabs, then the open tab. The Verdict tab gives the short answer. The Details tab gives Sun is up or Sun is down, and the same for Earth, with the countdowns.
- The point and the time controls.
- The globe. Drag on the globe to turn it. Use two fingers to zoom. To scroll the page, touch the page above or below the globe.
- The sky plot (only with the Details tab open).
- The site map. It is folded at the start. Tap ▸ Map to open it.
- The other sections: with the Details tab open, Now, the result for the period, the events, saved searches and the view controls.
The comparison fills the screen. Scroll the table to the side to see all columns.
4. Select a site #
You can select a point in five ways. The results are always for one point.
Search a place by name
- Type a name in Search a place on the Moon. For example, type Tycho, Shackleton or Sea of Tranquility.
- A list shows up to 8 names. Each name shows the feature type and the diameter.
- Click a name. Or use the arrow keys and push Enter. Escape closes the list.
The tool selects the centre point of the feature. The globe turns to this point. The result is for this one point, not for the full feature. A large feature, for example a mare, can have very different conditions at its edges.
The list has about 9,000 names from the IAU/USGS Gazetteer of Planetary Nomenclature. It has the names that the IAU approved. You can type the Latin name or the English name of a mare, a bay, a lake or a marsh. Upper case, lower case and accents do not change the result. Type the full name of a site in the site list and push Enter to select that site.
Site list
The Site list has 22 sites:
- 15 past landings: Apollo 11, 12, 14, 15, 16 and 17, Chang'e 3, 4, 5 and 6, Chandrayaan-3, SLIM, IM-1, IM-2 and Blue Ghost Mission 1.
- 7 Artemis III candidate regions near the south pole.
The list shows the sites in two groups: Artemis III candidate regions and Past landings. The list also has the default point, Shackleton–de Gerlache ridge (default). The tool opens at this point. — Custom point — shows when you typed coordinates or clicked a point.
Select a site. The globe turns to the site, and the results panel loads new results. The text below the fields gives the source of the site position.
On the globe, a green dot is a candidate site. A grey dot is a past landing. A red dot is the selected point.
Typed coordinates
- Type the latitude in Lat (°).
- Type the longitude in Lon (°).
- Click Go.
Use decimal degrees. These rules apply:
- Latitude: −90 to +90. South is negative. Do not use exactly −90 or +90.
- Longitude: east is positive. You can use −180 to +180 or 0 to 360. For example, 137.31° W is −137.31 or 222.69. Both give the same point.
The coordinates are planetocentric, in the MOON_ME frame (see the Glossary). This is the frame of most lunar maps.
Click on the globe or the map
Click a point on the globe. The tool selects that point. A drag turns the globe and does not select a point.
You can also click a point on the site map. The globe then follows.
Load a saved search
Click Load next to a saved search. The tool sets the point, the time and the observer height of that search.
Back and Forward
Did you click a different point by mistake? Click ↶ Back next to the Point header. The tool goes back to the previous point, period and observer height. ↷ Forward goes to the next one again. The Back and Forward buttons of your browser do the same. The tool keeps the last 50 changes. Play and the time slider do not make changes in this list.
5. Time and period #
All times in the tool are in UTC (see the Glossary).
The time box sets the period. The period starts at the start time and continues for the duration. For a mission, the start is the landing time and the duration is the mission length. All results use this period.
Start
Set a date and a time in Start (UTC). Or click Now to start the period at the current time.
Duration
Click a duration: 1 week, 1 month (30 days), 3 months (91 days) or 1 year (365 days). Or type a number of days from 1 to 400 in Custom duration. The default duration is 30 days.
The line below the slider gives the period in UTC and the time step. A long period uses a larger step, so the tool stays fast: 10 min up to 31 days, 30 min up to 100 days, and 60 min for a longer period.
Slider
The slider goes from the start (left) to the end of the period (right). The label above the slider shows the time from the start, for example "+2 d 06 h". The line below the slider shows the full UTC time. The countdowns, the values and the sky plot follow the slider. The slider does not load new data, so it is fast.
Play
- Select a speed: 1 min / s, 1 hour / s, 6 hours / s, 1 day / s or 1 week / s. At 1 week / s, a 1-year period plays in about 1 minute.
- Click Play. The time moves forward from the slider time.
- Click Pause to stop.
Play stops at the end of the period. Click Play again to start again from the start.
Results for the period
The result for the period, the event list and the sky plot tracks use the full period. A new start or a new duration gives new results. See Result for the period.
6. Read the results #
Verdict
The Verdict tab is the first tab of the results panel. It gives a short answer for the full period: the start and the duration in the time box. It is for the public and for mission planners.
- Headline. One sentence with the site, the dates and the answer. For example: "Good site for this period: sunlight and a direct link to Earth all the time." Or: "Difficult: no direct link to Earth for at least 7 d. The lander needs a relay satellite."
- Solar power. The part of the period with the Sun up, and the longest night. The battery must last this time.
- Talk to Earth. The part of the period with Earth up, and the longest time without a direct radio link. For this time, the lander needs a relay satellite, or it has no contact.
- Both together. The part of the period with the Sun and Earth up together, and the longest time without both.
- Right now. The Sun and Earth at the slider time, and the next change.
Each block has a rating: ✓ Good, ◐ Limited or ✕ Poor. The grey line below the sentence gives the numbers for planners.
The rules:
- Good: up for 90 % of the period or more, and the longest gap is shorter than 1 day.
- Limited: not good, but up for 50 % of the period or more. Or up for some time, and the longest gap is shorter than 7 days.
- Poor: all other cases.
- Poor also: the Sun is up less than 5 % of the period, or Earth is up less than 25 % of the period. NASA excludes such areas for Artemis landers (Artemis Human Landing System update, NASA LaRC 2024).
The headline uses the lowest rating. Click How we rate in the tab to see the rules.
Our rating, not a NASA standard. NASA has no Good, Limited or Poor scale. NASA uses requirements for each mission. Use Mission requirements below for a pass or fail answer.
Near the south pole, Earth is below the horizon about 2 weeks of each month, even at the best sites. The best known sites have sunlight about 92 to 96 % of the time, but Earth only about 50 % of the time (JPL IPN Progress Report 42-176, 2009. Gläser et al., 2014). The Talk to Earth block shows this sentence for points south of 80° S.
The planner lines use NASA metric names: average illumination (part of the period with the Sun up), longest continuous darkness (the longest night) and Earth visibility (part of the period with Earth up).
Mission requirements
This box is below the three blocks. It compares the period with three limits. Each line shows ✓ (meets the limit), ✕ (does not meet the limit) or ? (not known). The first line gives the count, for example "Meets 2 of 3 mission requirements."
- Longest darkness the hardware survives. Default 50 hours. Source: VIPER mission planning (SpaceOps 2022). A VIPER "safe haven" has 50 hours of darkness or less. The tool compares the longest continuous darkness in the period with the limit. If the darkness touches the start or the end of the period and is shorter than the limit, the result is ?. Check a longer period.
- Continuous sunlight needed from the start. Default 6.5 days. Source: NASA Lunar Site Selection white paper (2023). The first Artemis landing site must have sunlight for the full surface stay of about 6 to 6.5 days. The Sun must be up at the start, and the first sunset must come at least this long after the start. If the Sun does not set in the period and the period is shorter than the limit, the result is ?.
- Minimum Earth visibility. Default 25 %. Source: Artemis Human Landing System update (NASA LaRC, 2024). NASA excludes areas with Earth visibility below 25 %.
Next landing window
This part is at the bottom of the Mission requirements box. It finds the next time when a landing meets all three limits. The rule: from the landing time, the Sun is visible for all of the stay, and Earth is visible for the minimum Earth visibility or more. The stay is the "Continuous sunlight" limit, for example 6.5 days. Then the darkness limit also passes, because there is no darkness.
- The tool searches the 60 days after the start of the period, with a step of 30 minutes. The times are correct to 30 minutes.
- If the start is in a landing window, the box says so and gives the time when the window closes. This is the last landing time that is valid.
- If the start is not in a window, the box gives the next window, for example "Next landing window: land between 2028-02-03 13:00 and 2028-02-16 18:30 UTC. It opens 12 d 13 h after the current start". Click Use this start to set the start to the window open time and the duration to the stay. The Verdict then shows the result for this landing.
- If there is no window, the box says "No landing window in the 60 days after the start."
- The search uses the same point and observer height. It runs again when you change the point, the start, the height or a limit. Where the tool has no terrain data, the search uses a flat horizon.
You can change each limit. Type a number only. Click NASA defaults to go back to the defaults. The browser keeps your limits for your next visit. Each source name in the box is a link to the NASA document.
"At least" means that the gap touches the start or the end of the period. The real gap can be longer. Such a gap does not count as a short gap. Make the period longer to find its full length.
The tab also has the observer height (see Observer height) and Save search. The observer height is the same in both tabs. The tool keeps the last open tab for your next visit.
Limits: "Earth up" uses Earth's centre only. The result is for one point, not for the full site area. Where the tool has no terrain data, the horizon is flat.
Details
The Details tab gives all the values. The sections below describe them.
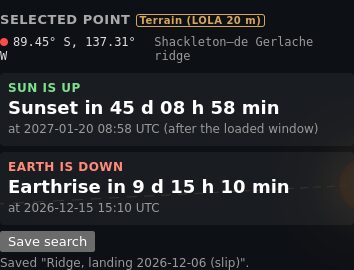
Sun up and Sun down
Sun is up means that some part of the Sun's disk is above the horizon. Sun is down means that all of the disk is below the horizon. The horizon is the terrain horizon where the tool has terrain data. Elsewhere, the horizon is flat, at 0°.
Earth up and Earth down
Earth is up means that the centre of Earth is above the horizon. Earth is down has two possible causes:
- Earth is below the horizon. The Earth elevation is negative. Earth is on the other side of the Moon for this point.
- Earth is behind the terrain. The Earth elevation is positive, but a hill or a crater rim in that direction is higher. The Earth margin is then negative.
Look at the sky plot to see which cause applies. The brown area is the terrain.
Countdowns
Each countdown gives the time from the slider time to the next change. For example, "Earthrise in 9 d 15 h 10 min". The line below gives the UTC time of the event.
- If the event is after the end of the period, the panel says, for example, "No sunset before the end of the period (7 d)". The line below gives the time of the next sunset after the end. The server finds the event up to 400 days after the end.
- If there is no event in those 400 days, the line below says so. This can occur near the pole.
The values in "Now"
| Value | Meaning |
|---|---|
| Sun elevation | The angle of the Sun's centre above the flat 0° horizon. It can be negative while the Sun is up, if the terrain horizon is below 0° in that direction. |
| Sun disk visible | The part of the Sun's disk that is above the horizon, in percent. 100 % is the full disk. 0 % means that the Sun is down. A value between them means that the Sun is on the horizon. |
| Earth elevation | The angle of Earth's centre above the flat 0° horizon. |
| Earth margin above horizon | The Earth elevation minus the terrain horizon elevation in the Earth direction. A positive value means that Earth is up. A small value (less than about 1°) means that part of Earth's disk is behind the terrain. |
| Sun az / el, Earth az / el | The azimuth and the elevation of the Sun and Earth (see the Glossary). |
Result for the period
The result is for the full period, from the start to the end. Use it as the mission result.
- Time with Sun, Time with Earth and Time with both: the percent of the period with the Sun up, with Earth up, and with both up.
- Mean Sun disk visible: the mean of "Sun disk visible" over the period. It is a better guide to solar power than "Time with Sun".
- Longest Sun period, Longest Earth period and Longest period with both: the longest time without a change. Use them to find the longest time that a lander can work without a break.
Below the table, the mission lines give the worst cases for the period:
- Longest night. The longest time without the Sun. The lander must survive this time without sunlight.
- Longest Earth outage. The longest time without Earth. There is no direct radio link to Earth for this time.
- Longest time without Sun and Earth together.
- At the start. The Sun and Earth at the start of the period (for a mission: at landing).
- First sunset. The time from the start to the first sunset.
A line in red is a risk: a gap of 24 hours or more, or the Sun or Earth down at the start. If a gap touches the start or the end of the period, the line says "from the start of the period" or "until the end of the period". The real gap can then be longer. Make the period longer to find its full length.
Events
The event list gives all sunrises, sunsets, Earthrises and Earthsets in the period, in time order and in UTC. ▲ is a rise. ▼ is a set. The line above the list gives the number of events.
- The right column gives the time from the slider time, for example "in 3 d 4 h" or "2 d ago".
- Past events are grey. The next event is bold.
- Click All, Sun or Earth to show only some events.
- A yellow bar marks a short pair: a set and a rise of the same body less than 6 hours apart. The Sun or Earth then skims the terrain. The line below the pair gives the time between the two events.
- For a long period, the list scrolls. The list scrolls to the next event.
- Below "After the period", the list gives the next events after the end of the period. The server finds them up to 400 days after the end.
Why the south pole is special
At the poles, the Sun and Earth do not rise high. They move around the horizon and stay a few degrees above or below it. Thus a small hill can hide them for days. A high ridge can have the Sun for weeks or months. A deep crater can have no Sun at all.
Earth also moves up and down by a few degrees in a cycle of about 27 days. This movement is part of libration. At the pole, it causes long periods with Earth and long periods without Earth.
For this reason, the south pole is a good place for solar power and for water ice. It is also a difficult place to plan a landing. Near the equator, the Sun is up for about 14.8 days and down for about 14.8 days, and Earth is always at almost the same place in the sky.
7. The sky plot #
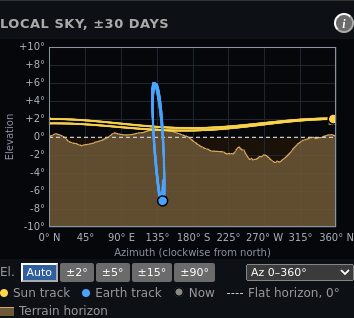
The sky plot shows the sky around the selected point in a time window. The window is 30 days from the start of the period. In 30 days, the Sun goes around the sky about one time.
- Left to right is the azimuth: the compass direction, from 0° (north) through 90° (east), 180° (south) and 270° (west).
- Bottom to top is the elevation: the angle above the flat horizon.
- Small yellow dots are the Sun at each time step of the time window. Small blue dots are Earth.
- Large dots show the Sun and Earth at the slider time.
- The dashed line is the flat horizon at 0°.
- The brown area is the terrain horizon. A body in the brown area is behind the terrain. You cannot see it from the point.
At a terrain point, the top edge of the brown area is the horizon, not the dashed line. A dot can be above the dashed line and still be behind the terrain. Then the card says Earth is down or Sun is down. At a point without terrain data, the dashed line is the horizon.
Click the i button next to the title to show a short help text.
Time window
When the period is longer than 30 days, a time strip shows below the plot. The strip is the full period. The box on the strip is the time window of the plot. The white line is the clock time.
- Drag the box to move the window. On a phone, drag it with your finger.
- Click the strip to move the box to that time.
- Use the mouse wheel on the strip, or the − and + buttons, to make the window longer or shorter. The window is 1 day to the full period.
- 30 days sets the window length to 30 days. Full period shows all the time steps of the period.
- With the keyboard, select the box. The arrow keys move it by 1 day.
When the clock time leaves the window (with the slider or Play), the window moves by its length to show the clock time. A new start or a new duration sets the window back to 30 days from the start.
Zoom buttons
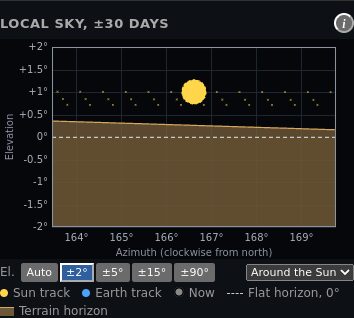
- El. buttons set the elevation axis: Auto, ±2°, ±5°, ±15° or ±90°. You can also use the mouse wheel on the plot.
- The azimuth list sets the azimuth axis: Az 0–360°, Around the Sun or Around Earth. The last two use the same scale on both axes.
When you zoom in, the Sun and Earth show as disks of their true size. The Sun disk is about 0.53° wide. Earth is about 1.9° wide. The terrain hides the part of a disk that is below the horizon line.
8. Observer height #
The observer height is the height of the eye, the solar panel or the antenna above the ground. The default is 2 m.
- Ground 0 m: a person who lies on the ground, or a sensor on the surface.
- Lander 2 m: a solar panel or an antenna on a small lander.
- Mast 10 m: a tall mast or a tower.
You can also type a value from 0 to 1000 m in Observer height (m).
Why it matters. A higher observer sees over nearby rocks and small hills. Near the pole, the Sun and Earth are often less than 1° above the terrain. Thus a few metres can add hours or days of Sun or Earth. Near the equator, the observer height has almost no effect.
A new observer height loads a new terrain horizon and new results.
9. Terrain #
The tool calculates the terrain horizon from NASA LOLA elevation data (see the Glossary). The tag next to Selected point tells you which horizon the results use.
| Tag | Meaning |
|---|---|
| Terrain (LOLA 20 m) | A LOLA horizon mask. The near terrain uses 20 m data. This is the best case. It applies south of 80° S. |
| Terrain (LOLA 120 m) | A LOLA horizon mask with 120 m data only. The point is north of 80° S. The near horizon has less detail. |
| Flat horizon (no terrain data here) | The point is north of 60° S. The elevation data does not cover it. The horizon is flat, at 0°. This is normal. |
| Flat horizon: terrain not available. Results can be wrong. | The elevation data covers the point, but the server cannot read it. The results use a flat horizon. |
| Provided | The request included its own horizon mask. This occurs only with the API. |
Do not use a result with the red tag for a polar point. Near the pole, the terrain controls the result. A flat horizon can show the Sun or Earth as up when the terrain hides them. Select a curated site, or try again later.
When to trust a flat horizon
Near the equator, the Sun and Earth rise high. A flat horizon then has only a small effect on the results. But a large crater or a hill near the point can still change the time of a sunrise or a sunset.
How to check that the terrain is plausible
- Open the sky plot. Look at the brown area. A crater floor has a high horizon in all directions. A ridge or a crater rim has a low horizon.
- Move the time slider. The Sun must go down when its large dot goes into the brown area.
10. The globe views #
The globe shows the Moon at the slider time. The lit half faces the Sun. The globe is not to scale. Earth and the Sun are closer and smaller than in reality. The globe relief does not cast shadows. Use the results panel, not the globe shading, to decide if a point has Sun.
Screen up is the Moon's north pole. The line through the poles is the spin axis of the Moon.
| Control | What it does |
|---|---|
| Default view | Shows the Moon, Earth and the Sun direction together, from a point behind Earth. |
| View from Earth | Shows the Moon as an observer on Earth sees it. You see the near side and the current phase. |
| View south pole | Looks down on the south pole. Use it to see the sites near the pole. |
| True scale Earth | Shows Earth at its true size and distance. Earth is then about 220 Moon radii away. |
| Earth and Moon, true scale | Sets the true scale and moves the camera so that you see Earth and the Moon together. |
| Show latitude/longitude grid, Show sites | Show or hide the grid and the site dots. |
| Camera turns with the Moon | The camera follows the rotation of the Moon. A point on the Moon then stays at the same place on the screen. |
| True sky orientation (view from Earth) | Screen up is celestial north, as an observer on Earth sees the Moon. |
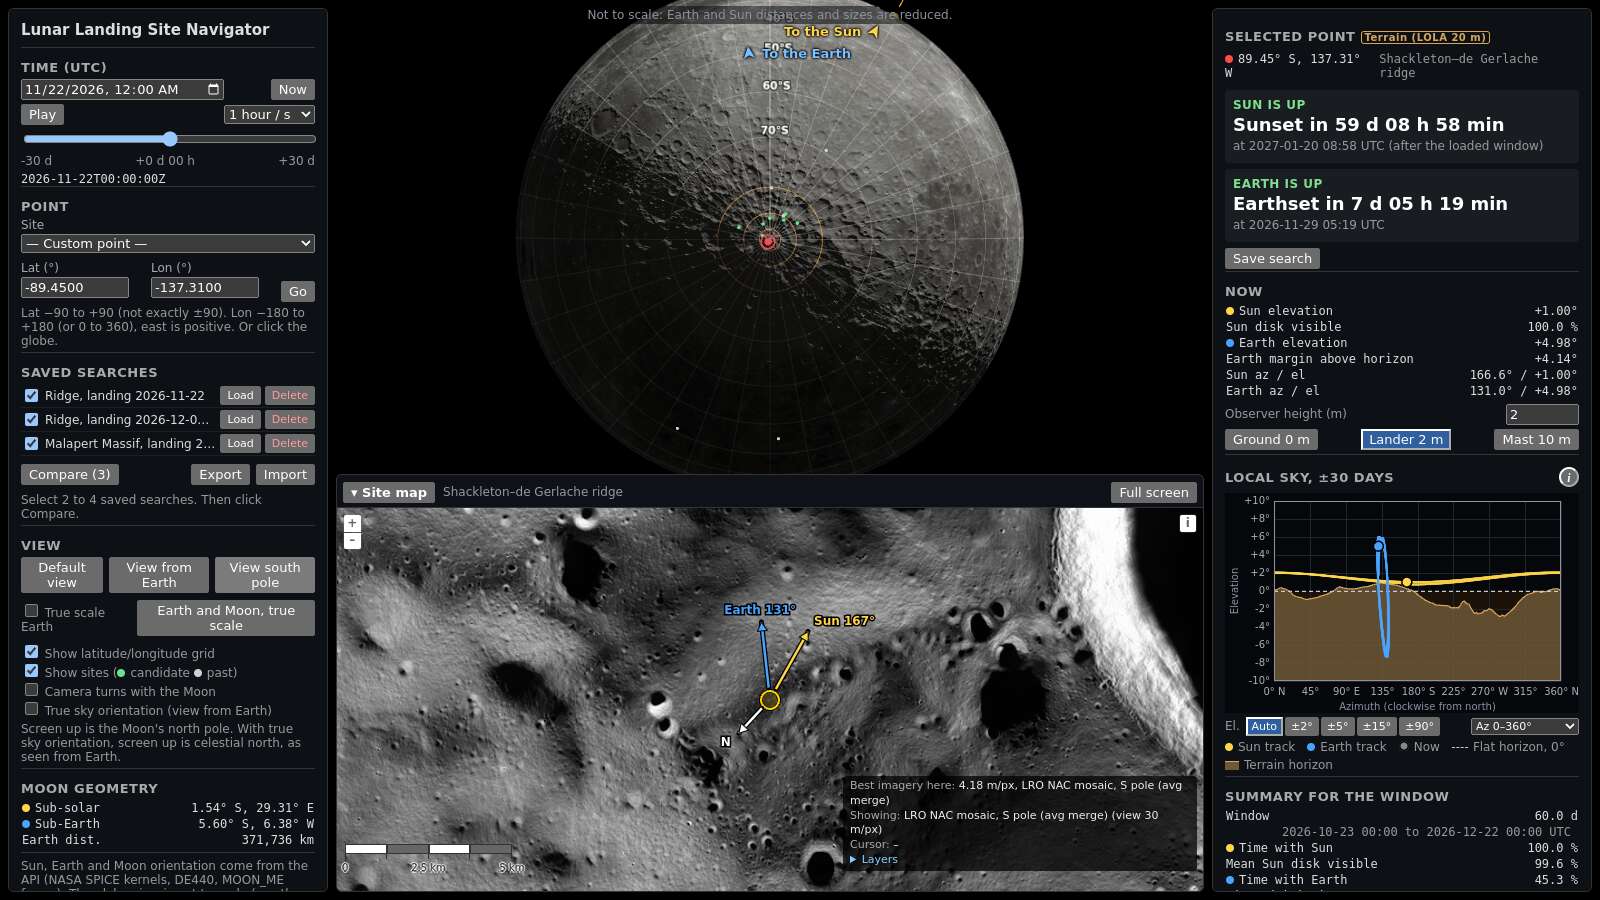
Edge arrows
When the Sun or Earth is on the screen, a small label shows next to it. When it is off the screen, an arrow at the edge of the globe area points to it. The arrow label says "To the Sun" or "To the Earth".
In Earth and Moon, true scale, the Moon is small, so it gets the label "Moon". The Sun marker stays near the Moon, because the Sun distance is not to scale. Its label is "Sun direction".
Moon geometry
The Moon geometry table in the left panel gives the sub-solar point, the sub-Earth point and the Earth distance (see the Glossary).
11. The site map #
The site map is at the bottom of the screen. It shows NASA images around the selected point. A small circle marks the point. A larger circle shows the site radius, if the site has one.
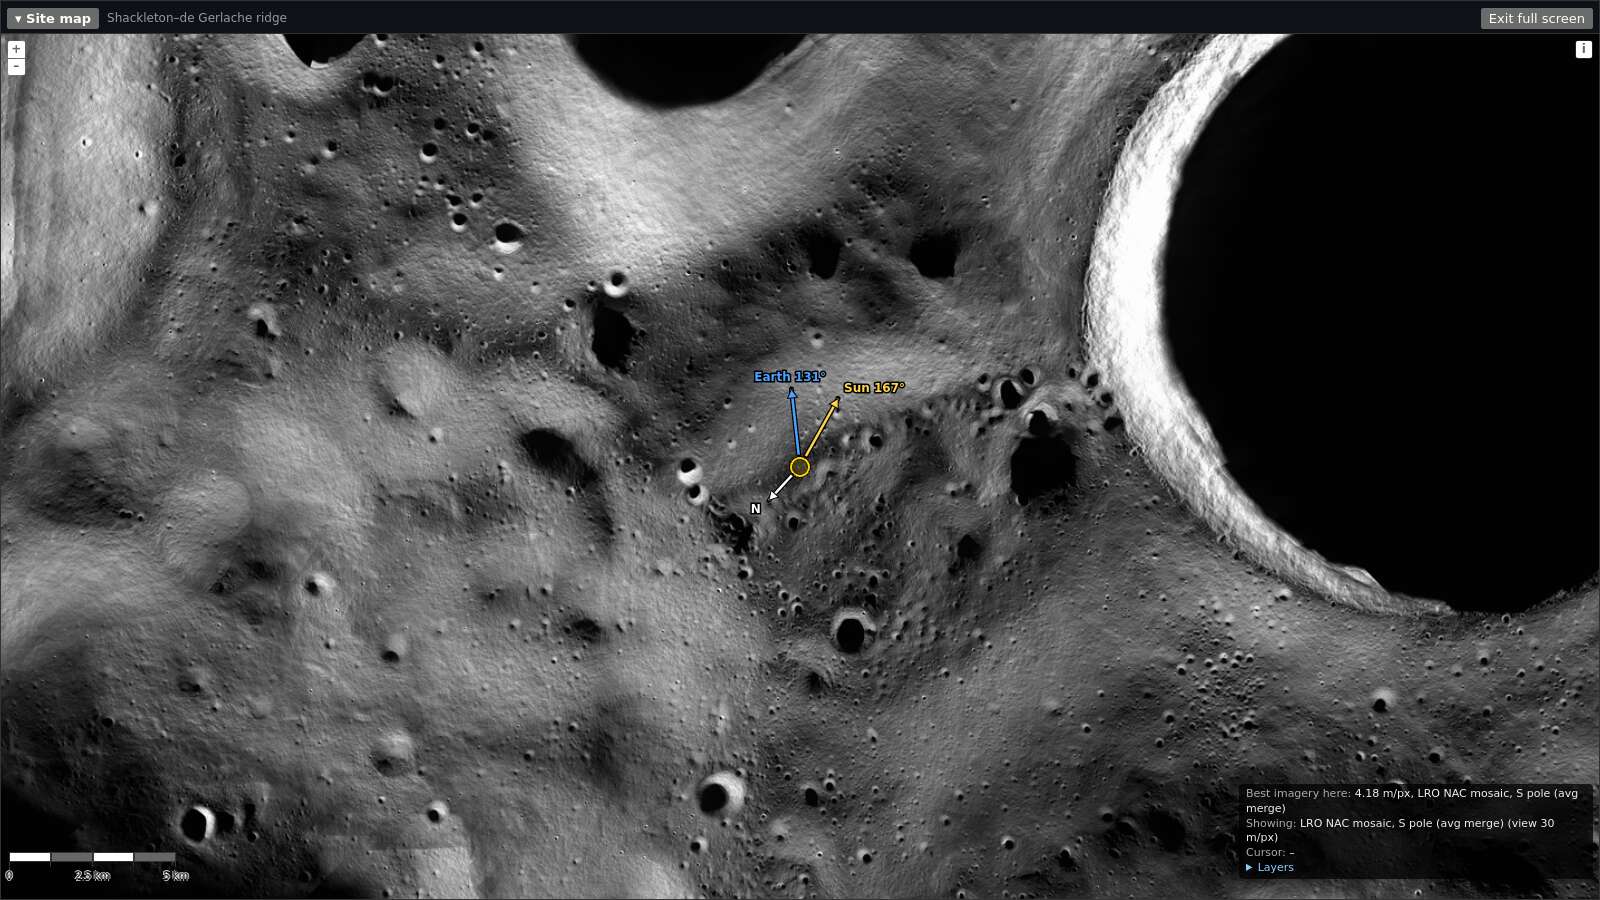
- Arrows. The yellow arrow points in the Sun direction (azimuth). The blue arrow points in the Earth direction. A dashed, dim arrow means that the body is down. The label gives the azimuth, for example "Sun 167°".
- Layers. Click Layers in the box at the lower right. Select the images to show. For example, the LOLA hillshade shows the relief. The PSR mosaic shows the floors of permanently shadowed regions.
- Box at the lower right. It shows the best image for this point and its resolution in metres per pixel.
- Full screen. Click Full screen to make the map fill the window. Click Exit full screen to go back.
- Fold. Click ▾ Map to hide the map and see more of the globe.
- Select a point. Click on the map to select that point.
On a phone, the site map is in the page, below the sky plot. It is folded at the start.
LROC QuickMap link
The link Open in LROC QuickMap (slope in degrees) is in the site map header and below the point fields. It opens LROC QuickMap (NASA LRO) in a new tab. The map is centred on the selected point. The TerrainSlope layer is on, with a legend in degrees.
- South of 75° S, QuickMap uses a south polar view with the NAC south pole mosaic.
- For a site with a radius, the zoom shows all of the site circle.
Use QuickMap to measure slope at a point that is north of 80° S. The slope layer of this tool does not cover it.
Slope layer
The site map has a slope layer for the south pole region.
- Click Layers in the box at the lower right of the site map.
- Select Slope (LOLA 20 m, degrees).
- Classes. The colours show 6 classes: <5°, 5–10°, 10–15°, 15–20°, 20–30° and ≥30°. A legend shows the colours.
- Area. The layer is only south of 80° S. North of 80° S, a note tells you to use the QuickMap link.
- Steepest slope. Each pixel shows the steepest slope inside it. Thus, a coarse view does not hide a steep spot.
- Source. The slope comes from the LOLA 20 m elevation data (LDEM_80S_20MPP_ADJ). Rocks and small craters that are smaller than 20 m are not in it.
Average sunlight and Earth visibility layers
The site map has two layers from NASA data (NASA PGDA product 69, Mazarico et al. 2011):
- Average sunlight (NASA PGDA, 18.6 years): the percent of time that a part of the Sun is above the local horizon.
- Average Earth visibility (NASA PGDA, 18.6 years): the percent of time that a part of the Earth is above the local horizon.
- Click Layers in the box at the lower right of the site map.
- Select one of the two layers. The layers are off when the map opens.
You can turn on only one of the two layers at a time. When you turn on one layer, the other layer goes off. To see both, use the Sun and Earth tab.
- Colours. Dark is 0 % (no light). Light yellow is 100 %. A legend shows the colours.
- Area. The layers are only south of 75° S. The map pixel is 60 m south of 85° S and 120 m for 75–85° S.
- Mean value. Each pixel shows the mean value inside it.
- Slightly high values. A pixel counts as "visible" if any part of the disc is visible. Thus, the values are slightly optimistic.
Sun and Earth tab
The site map header has two tabs: Site map and Sun and Earth. The Sun and Earth tab shows two maps of the same area. The left map shows average sunlight. The right map shows average Earth visibility. On a phone, the sunlight map is above the Earth map.
- Same view. When you pan or zoom one map, the other map moves with it. Thus, you can compare the same place on the two maps.
- Markers. Each map shows the selected point, the site circle and the numbered best points.
- Select a point. Click a point on one of the two maps. The tool then selects that point, as on the site map.
- Keyboard. Put the focus on a tab. Use the left and right arrow keys to change the tab.
- Area. The data is only south of 75° S. North of 75° S, the tab shows a note and no maps.
Best points in this site
Select an Artemis III region, a past landing or another curated site south of 75° S. Below the site description, the list Best points in this site (NASA PGDA long-term average) shows up to 5 points. The site map shows the same points as small numbered markers.
- Rank. The points are in order of the mean of average sunlight % and average Earth visibility %.
- Slope. Each point has a slope less than 15°. The slope is the steepest LOLA 20 m slope in the map pixel.
- Distance. The points are at least 500 m apart.
- Small sites. For a small site (for example a past landing with radius 500 m), the tool searches 5 km around the site centre. The list title is then Best points within 5 km, and the site map circle shows the 5 km search area.
- Select a point. Click a row. The tool selects that point and calculates the results for it. The site circle and the list stay on the screen.
Long-term average and the result for the period
The layers and the list show long-term averages. NASA calculated them over 18.6 years in hourly steps, at ground level. The results panel shows a different thing: the result for your period and your observer height.
- A point with 60 % average sunlight can have sunlight 92 % of the time in a good month, and much less in a bad month.
- A mast or a solar panel above the ground sees more sunlight than the ground.
- Use the list to find good points. Then use the results panel to check the point for your mission dates and height.
12. Save and compare #
Save a search
A saved search keeps the point, the observer height, the start and the duration. Click Load to show it again. The time box then shows its start and duration.
- Select a point, a start, a duration and an observer height.
- In the results panel, click Save search. It is in both tabs.
- Type a name, or keep the name that the tool gives.
- Click Save.
The search shows under Saved searches in the left panel. Your browser keeps the list. Use Export to download the list as a file. Use Import to add searches from a file, for example on a different computer.
Compare 2 to 4 searches
- Select the check box of 2, 3 or 4 saved searches.
- Click Compare.
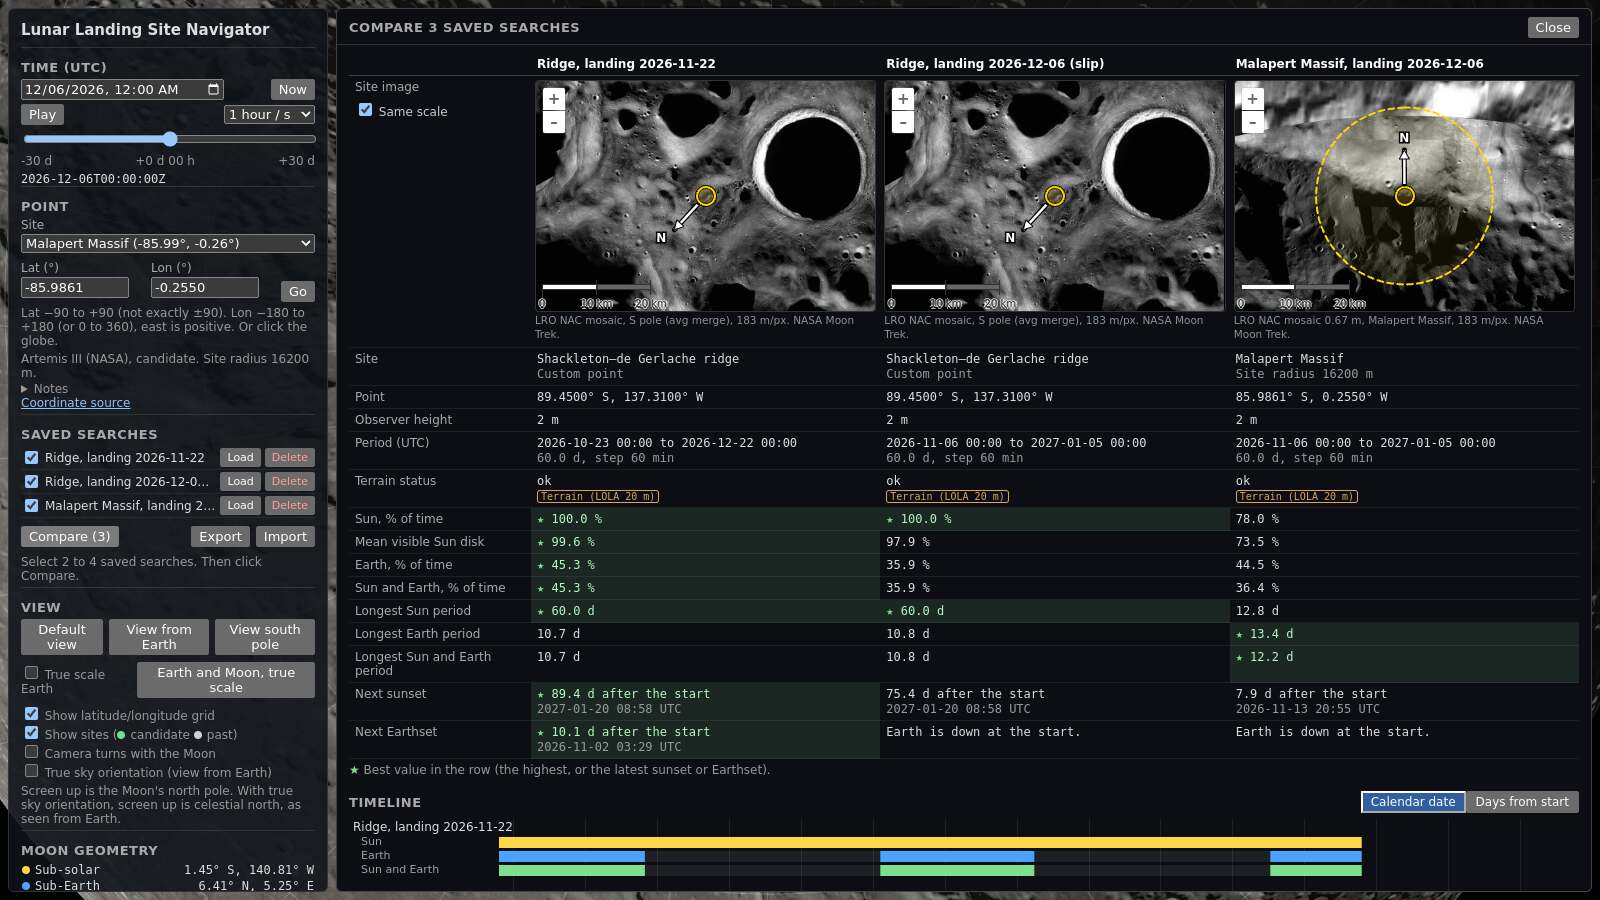
- The table has one column for each search. It gives the terrain status, the percent of time with the Sun, with Earth and with both, the mean visible Sun disk, the longest periods and the time to the next sunset and Earthset.
- The verdict rows. The first rows give the same result as the Verdict tab: the overall rating, the Solar power, Talk to Earth and Both together ratings, and how many mission requirements each search meets (with your current limits).
- The stars. A ★ marks the best value in a row: the highest value, or the latest sunset or Earthset.
- The site images show each point on a NASA image. Same scale on: all images use the same metres per pixel, so you can compare the sizes. Same scale off: each image fits its site.
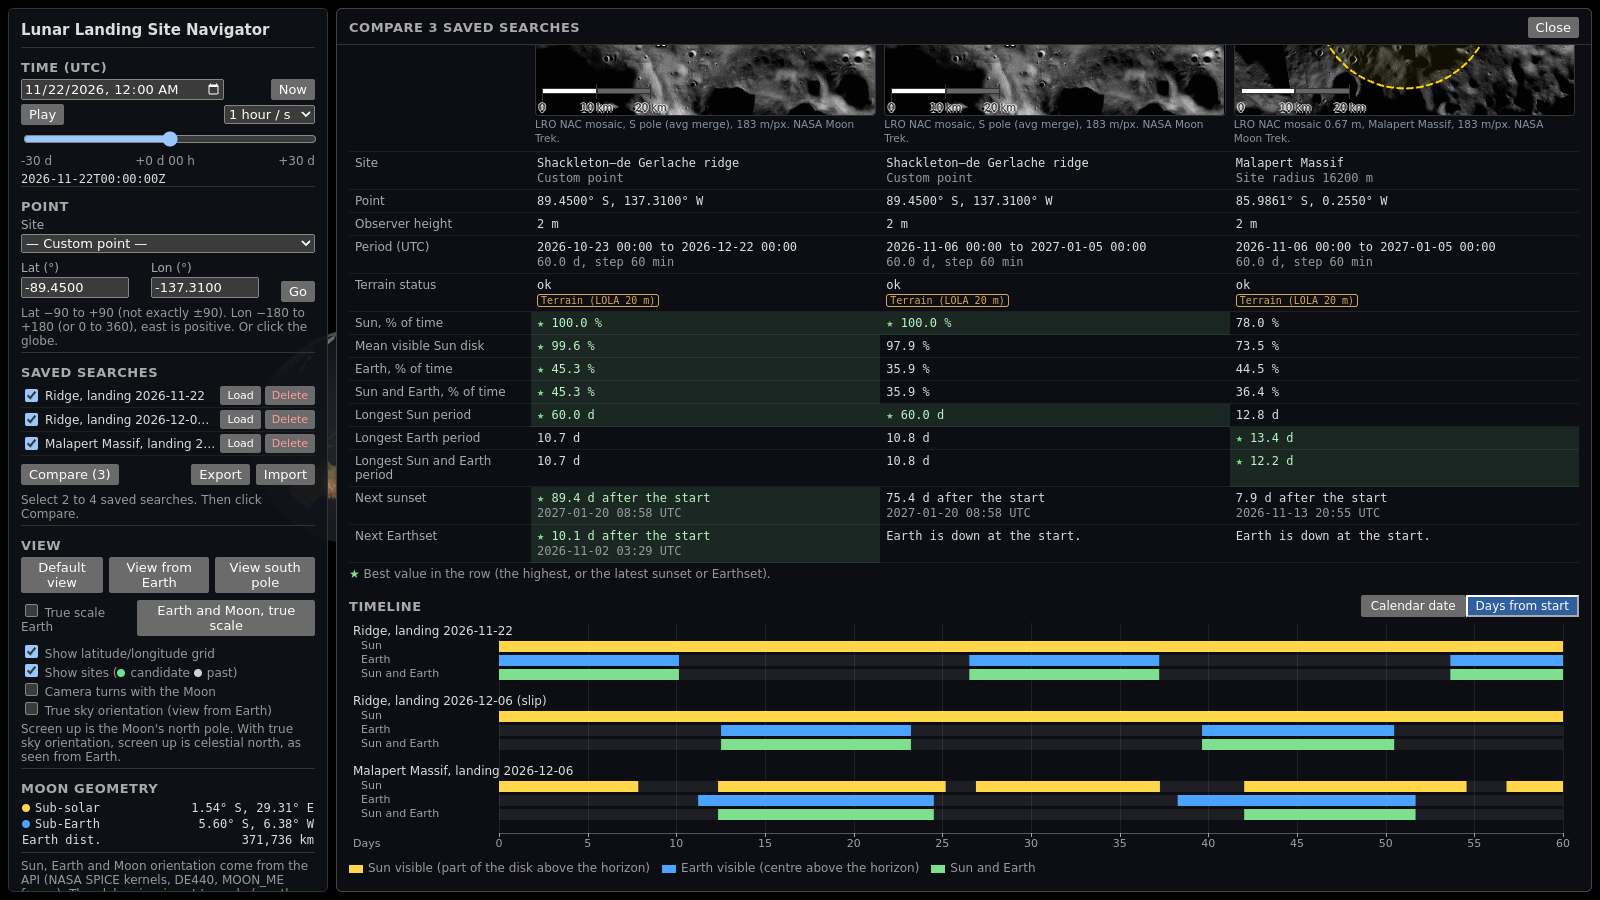
- The timeline shows three strips for each search: Sun, Earth, and Sun and Earth. A coloured part means "up".
- Calendar date uses one shared time axis, in UTC.
- Days from start starts each search at day 0. Use it to compare different dates.
Worked example: a 2-week launch slip
A mission plans to land at the Shackleton–de Gerlache ridge on 2026-11-22. Then the launch slips by 2 weeks, to 2026-12-06. The observer height is 2 m.
- Type −89.45 in Lat (°) and −137.31 in Lon (°). Click Go.
- Set Start (UTC) to 22 November 2026, 00:00. Click 1 month.
- Click Save search. Type the name "Ridge, landing 2026-11-22". Click Save.
- Set Start (UTC) to 6 December 2026, 00:00.
- Click Save search. Type the name "Ridge, landing 2026-12-06 (slip)". Click Save.
- Select Malapert Massif in the site list. Save it as "Malapert Massif, landing 2026-12-06".
- Select the three check boxes. Click Compare.
- Click Days from start. In each search, the landing date is at day 0.
The results panel shows these values at 00:00 UTC on each date (API values of 2026-11-15):
| Search | Sun | Earth | Earth margin |
|---|---|---|---|
| Ridge, 2026-11-22 | Up. Sunset in 59 d 08 h 58 min. | Up. Earthset in 7 d 05 h 19 min. | +4.14° |
| Ridge, 2026-12-06 | Up. Sunset in 45 d 08 h 58 min. | Down. Earthrise in 9 d 15 h 10 min. | −7.88° |
| Malapert Massif, 2026-12-06 | Up. Sunset in 7 d 06 h 55 min. | Down. Earthrise in 8 d 06 h 40 min. | −5.82° |
The comparison table gives these values for the 1-month periods (30 days from each landing date):
| Search | Sun, % of time | Earth, % of time | Sun and Earth, % of time | Longest Earth outage | Next Earthset |
|---|---|---|---|---|---|
| Ridge, 2026-11-22 | 100.0 % | 45.3 % | 45.3 % | 16.4 d | 7.2 d after the start |
| Ridge, 2026-12-06 | 100.0 % | 36.1 % | 36.1 % | 9.6 d, from the start | Earth is down at the start. |
| Malapert Massif, 2026-12-06 | 76.7 % | 44.7 % | 32.2 % | 8.3 d, from the start | Earth is down at the start. |
What the planner learns:
- On 2026-11-22, the ridge has the Sun and Earth. Earth sets after about 7 days.
- After the slip, the ridge still has the Sun. But Earth is below the horizon for the first 9 days. Thus direct communication with Earth is not possible without a relay satellite.
- At Malapert Massif, Earth is also down. The Sun sets after about 7 days.
- In the timeline with Days from start, the Earth strip of the slipped searches is empty at the start.
Next, the planner can save the ridge on 2026-12-16 and compare again. On that date, the Sun and Earth are both up at the ridge.
13. Check a result #
The Check this result part is at the bottom of the results panel. Click its title to open it.
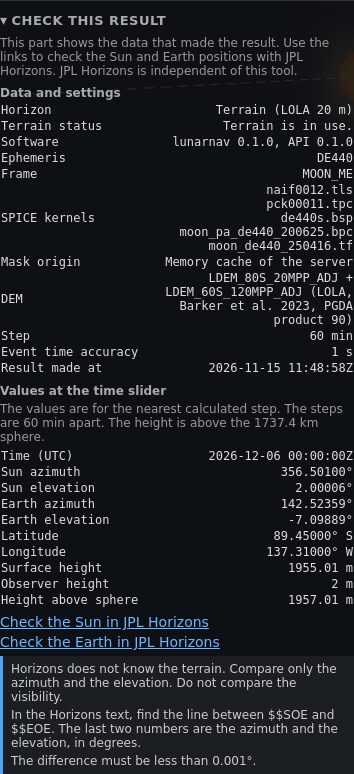
- Data and settings gives the horizon, the software versions, the ephemeris, the frame, the SPICE kernels, the origin of the terrain mask, the elevation data file and the time step.
- Values at the time slider gives the Sun and Earth azimuth and elevation at the nearest calculated step. It also gives the latitude, the longitude and the height above the 1737.4 km reference sphere.
JPL Horizons is the NASA JPL service for the positions of solar system bodies. It is independent of this tool. To compare the tool with Horizons, do these steps:
- Move the slider to the time that you want to check.
- Click Check the Sun in JPL Horizons. A new tab opens with the Horizons result for the same point, height and time.
- In the Horizons text, find the line between
$$SOEand$$EOE. The last two numbers are the azimuth and the elevation, in degrees. - Compare them with Sun azimuth and Sun elevation in the panel. The difference must be less than 0.001°.
- Do steps 2 to 4 again with Check the Earth in JPL Horizons.
Horizons does not know the terrain. Compare only the azimuth and the elevation. Do not compare "up" or "down".
Check how sensitive a result is
A result that changes a lot for a small change of input is a weak result. Use saved searches and the comparison:
- Save the same point at 0 m, 2 m and 10 m. Compare them.
- Save the point and two or three points 100 to 500 m away. If the Sun percent changes a lot, the landing accuracy is important at this site. For example, from 2026-11-06 to 2027-01-05, the Malapert Massif site centre (85.9861° S, 0.2550° W) has the Sun for 78.0 % of the time. A point about 120 m away (85.99° S, 0.26° W) has the Sun for only 34.9 % of the time.
- Save the same point with a date 1 or 2 weeks later. Compare them with Days from start.
14. Glossary #
- Azimuth
- The compass direction to a body, measured clockwise from north. North is 0°, east is 90°, south is 180° and west is 270°.
- Elevation
- The angle of a body above the flat horizon. 0° is on the flat horizon. 90° is straight up. A negative value is below the flat horizon.
- Horizon mask
- A list of the terrain horizon elevation for each direction. The tool uses one value for each 0.5° of azimuth.
- Terrain horizon
- The elevation angle of the highest terrain in each direction, as seen from the observer. The tool calculates it from LOLA elevation data, up to 150 km from the point. It includes the curvature of the Moon.
- Observer height
- The height of the observer (an eye, a solar panel or an antenna) above the ground at the point.
- Sub-solar point
- The point on the Moon where the Sun is straight up. It is the centre of the lit half.
- Sub-Earth point
- The point on the Moon where Earth is straight up. It is near the centre of the near side.
- Libration
- A small, slow change of the Moon's orientation as seen from Earth. Because of libration, the sub-Earth point moves by a few degrees. At the poles, Earth thus moves up and down near the horizon.
- Terminator
- The line between the lit half and the dark half of the Moon.
- Ephemeris
- A table or a model that gives the positions of solar system bodies at each time. The tool uses the NASA JPL DE440 ephemeris.
- MOON_ME
- The "Moon Mean Earth / Polar Axis" reference frame. Lunar maps and the LOLA data use this frame. The latitudes and longitudes in the tool are in this frame.
- UTC
- Coordinated Universal Time. It is the time standard of the world. It is not your local time.
- Permanently shadowed region (PSR)
- An area, often a crater floor near a pole, that never gets direct sunlight. These areas are very cold and can contain water ice.
- LOLA
- The Lunar Orbiter Laser Altimeter on the NASA Lunar Reconnaissance Orbiter. It measured the height of the lunar surface.
15. Limits #
- "Earth up" uses the centre of Earth, not its edge. Earth is about 1.9° wide as seen from the Moon. Use the Earth margin to find marginal cases.
- There is no atmospheric refraction. This is correct for the Moon, because the Moon has no atmosphere.
- All times are in UTC. A lunar time standard (Coordinated Lunar Time) is in development. It does not change the geometry.
- The site radius is not used in the calculation. The result is for the centre point.
- A line of sight to Earth is not a full communication check. The antenna pattern, the power and the ground station time are not included.
- The tool samples the period in steps of 10 min (up to 31 days), 30 min (up to 100 days) or 60 min (longer periods), and then finds each event to 1 second. It can miss two events that are closer together than one step, for example a short sunrise behind a peak. The landing window search uses 30-min steps.
- The terrain data has 20 m and 120 m pixels. Small rocks and boulders are not in the data. Terrain more than 150 km away is not included.
- The globe is not to scale.
16. Data sources and credits #
- Sun, Earth and Moon positions: NASA NAIF SPICE toolkit and kernels, JPL DE440 ephemeris and DE440 lunar orientation (NASA JPL, Park et al. 2021). Python interface: spiceypy (Annex et al. 2020).
- Terrain: LOLA elevation models LDEM_80S_20MPP_ADJ and LDEM_60S_120MPP_ADJ, NASA GSFC Planetary Geodesy Data Archive, product 90, "A New View of the Lunar South Pole from LOLA" (Barker et al. 2023).
- Site map images: NASA Moon Trek. LRO WAC and NAC mosaics (LROC: NASA/GSFC/Arizona State University), LOLA hillshades (NASA/GSFC), Kaguya Terrain Camera mosaic (JAXA/SELENE).
- Globe: CGI Moon Kit, NASA Scientific Visualization Studio (LROC WAC colour mosaic and LOLA elevation). Earth: Blue Marble Next Generation (NASA Earth Observatory, Reto Stöckli). Sun: SDO/HMI image (NASA/SDO and the AIA, EVE and HMI science teams).
- Site positions: NASA NSSDC (Apollo) and LROC (other landings and the Artemis III regions).
- Place names: IAU/USGS Gazetteer of Planetary Nomenclature (USGS Astrogeology Science Center, public domain). Name, type, centre and diameter of each feature.
- Validation: JPL Horizons, NASA JPL.
- Software: three.js, OpenLayers, Vite, TypeScript, Python, FastAPI, numpy and rasterio.
This tool is an entry for the NASA Space Apps Challenge 2026, challenge "Lunar Landing Site Navigator".
Built with AI assistance (Claude Code) under the developer's direction and review. The data and the images come from NASA and JAXA sources. They are not AI-generated.
Privacy: this site uses no cookies and no tracking. Your browser keeps your saved searches and settings in its local storage, on your device only. To delete them, use "Delete" in Saved searches, or clear the site data in your browser settings.